
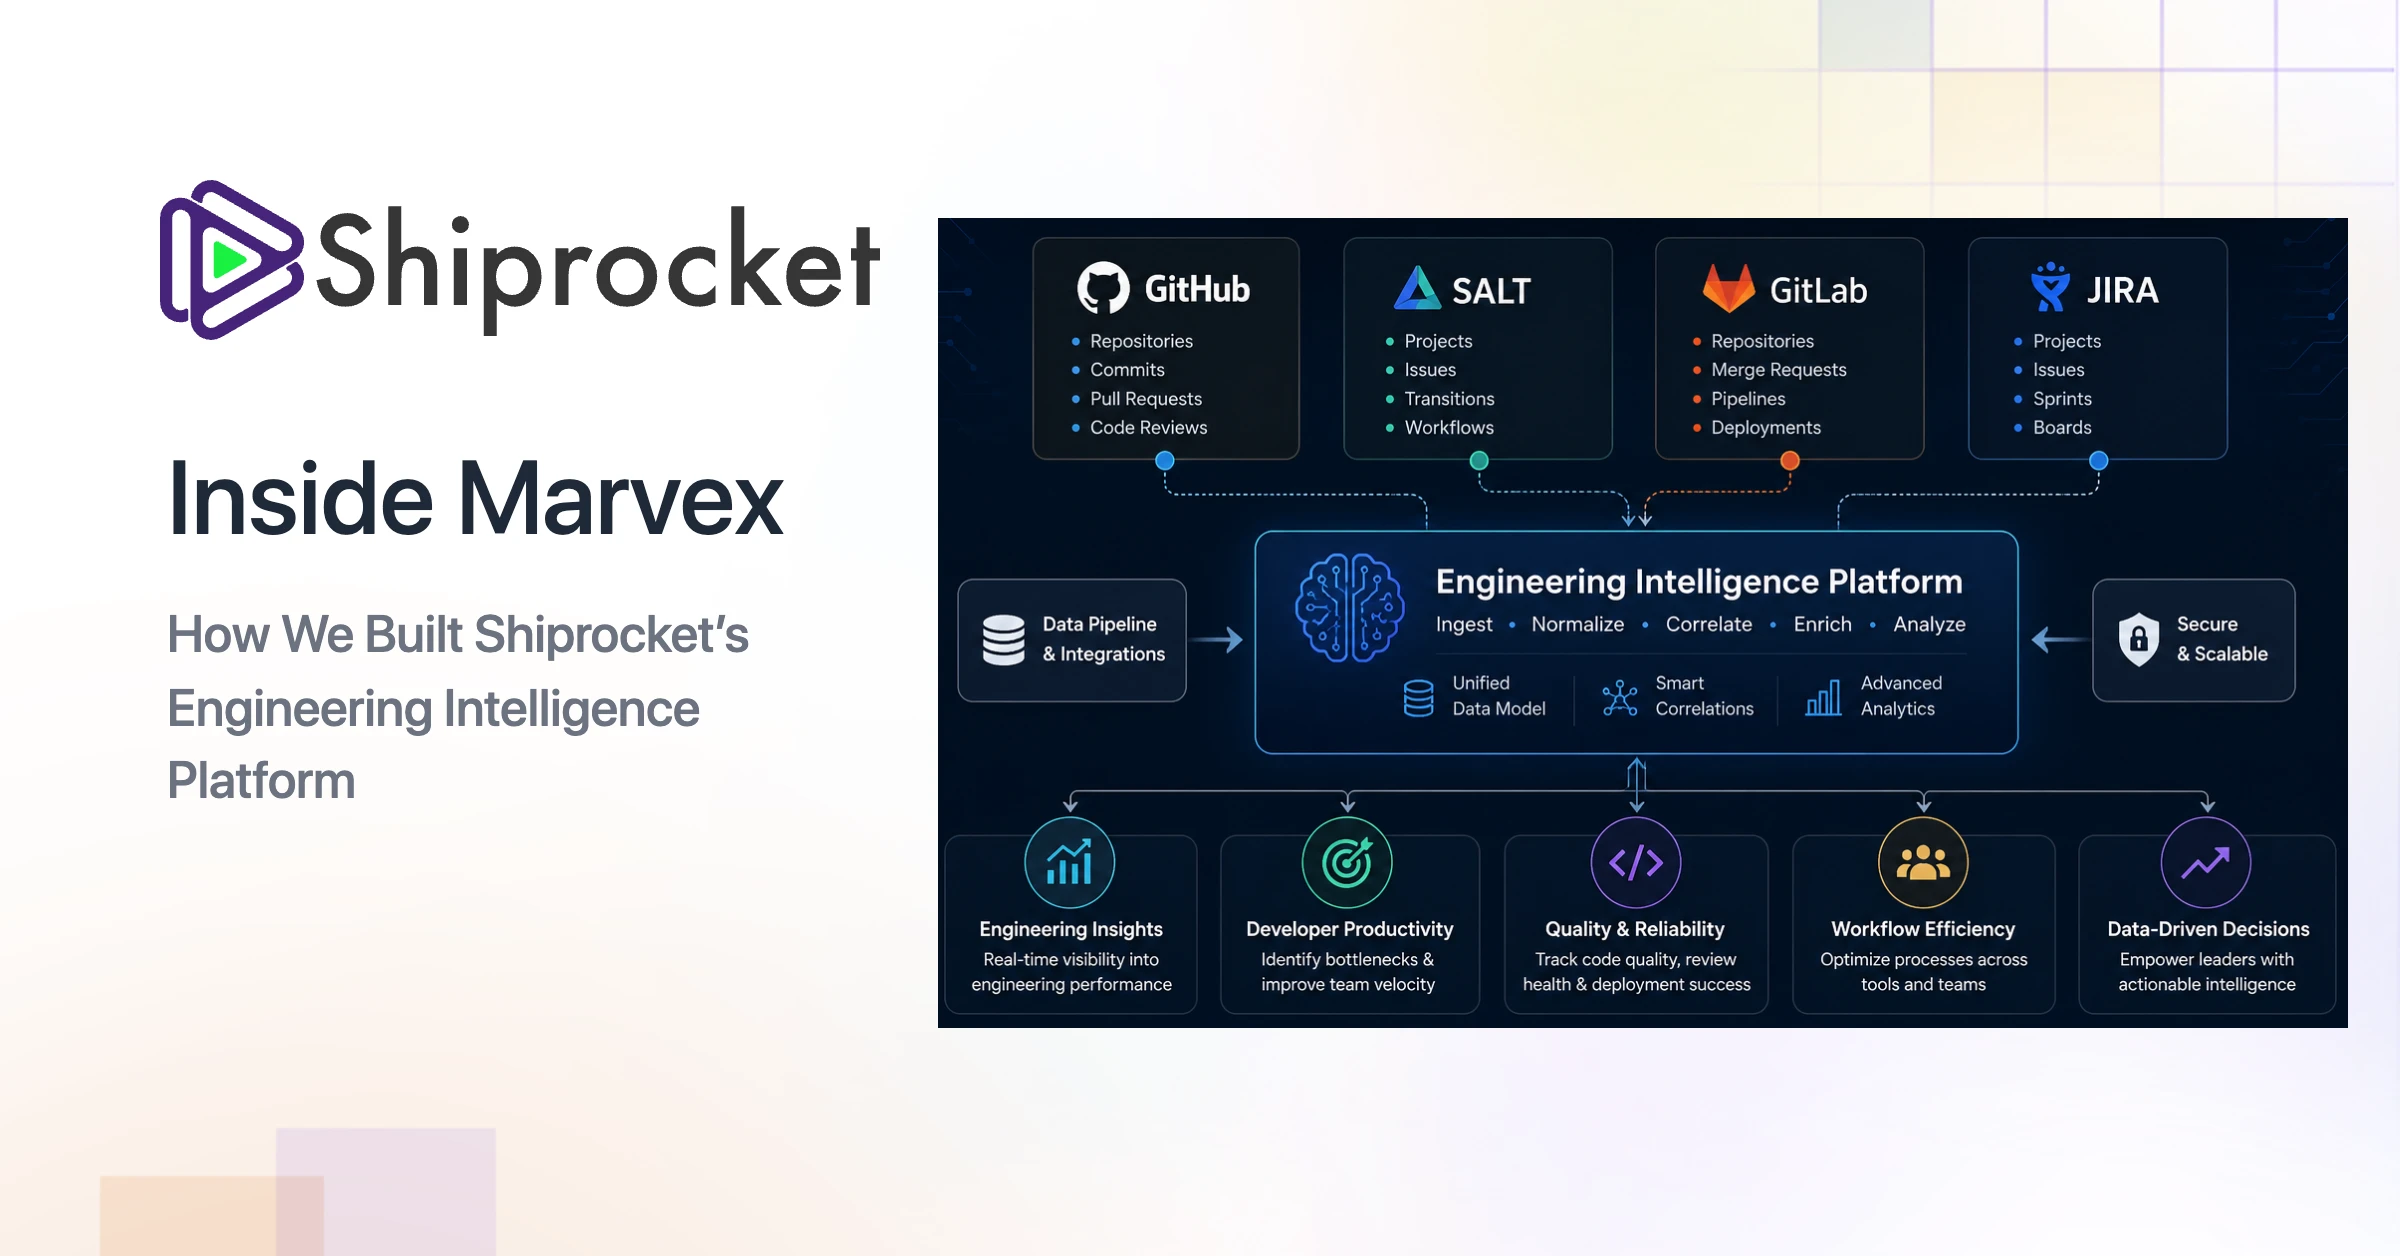
A technical tour of the platform that measures — and increasingly assists — how our engineering teams ship software.
Every engineering org eventually asks the same questions. How fast do we ship? Where do changes get stuck? Which teams are healthy, and which are quietly drowning? And are we actually getting value out of our tools — including the new AI ones?
We answer those questions with Marvex, our engineering-productivity analytics platform. Marvex brings together activity from tools like GitHub, GitLab and Jira, computes DORA metrics, and tracks team and sprint performance. On top of that foundation sit two products we’re especially proud of: SALT, a lightweight agile tracker, and Velo, a multi-channel AI assistant for engineering managers and their teams.
This post is a technical walkthrough of how it all fits together — the architecture, the data pipeline, and the design decisions behind the pieces we care about most.
What Marvex is, in one paragraph
Marvex is a multi-tenant analytics platform: data is strictly isolated per organization. A web API serves the product, while a separate background worker handles the slow job of pulling data from third-party developer tools. A relational database is the system of record, an in-memory store provides caching and coordination, and a modern web frontend serves the UI. Sensitive data — integration credentials and chat content — is encrypted at rest.
The high-level architecture
Marvex runs as a set of cooperating processes, each with a clear job:
                         ┌───────────────────────────┐
   GitHub / GitLab       │       Background worker    │
   Jira / Incidents ────▶│   (long-running data sync) │
                         └──────────────┬─────────────┘
                                        │ writes via a single data layer
                                        ▼
                             ┌────────────────────┐        ┌──────────────┐
                             │  Relational store  │◀──────▶│   Cache +    │
                             │ (system of record) │  cache │ coordination │
                             └─────────▲──────────┘        └──────────────┘
                                       │ reads / writes
                         ┌─────────────┴──────────────┐
   Browser / Slack  ────▶│          Web API           │
   WhatsApp              │  request → logic → data    │
                         └─────────────▲──────────────┘
                                       │ authenticated requests
                         ┌─────────────┴──────────────┐
   End users       ────▶│     Web frontend (BFF)     │
                         │   proxies, never hits DB    │
                         └────────────────────────────┘
Three ideas define this design:
- Slow work is separated from the request path. Pulling months of commit history or a full Jira board is slow, bursty and rate-limited. Keeping that in a background worker means a heavy backfill never stalls a dashboard load.
- The frontend is a backend-for-frontend (BFF), not a database client. It proxies requests to the API and forwards the user’s credentials. There is exactly one writer to the database — the API layer — which keeps our data-integrity story simple.
- Tenant isolation is an invariant. Every query is scoped to a single organization. This isn’t a convention we hope people follow; it’s a rule we enforce and review for.
A layered backend
The backend follows a strict layering that keeps business logic testable and data access centralized:
| Layer | Responsibility |
|---|---|
| API | Parse the request, authenticate, authorize, and route to the right service. No business logic. |
| Services | Business logic and orchestration, grouped by domain. Never touches the database directly. |
| Data access | A single layer where all database access lives. Tenant scoping, transactions and locking are centralized here. |
| Integrations | Clients for external providers — GitHub, GitLab, Jira and incident sources. |
| Shared utilities | Cross-cutting concerns: cryptography, caching, coordination locks, rate limiting, logging. |
Domains map cleanly to the product surface — code analytics, deployments, incidents, Jira, SALT, Velo, and the team and org dashboards.
The data pipeline: from event to dashboard
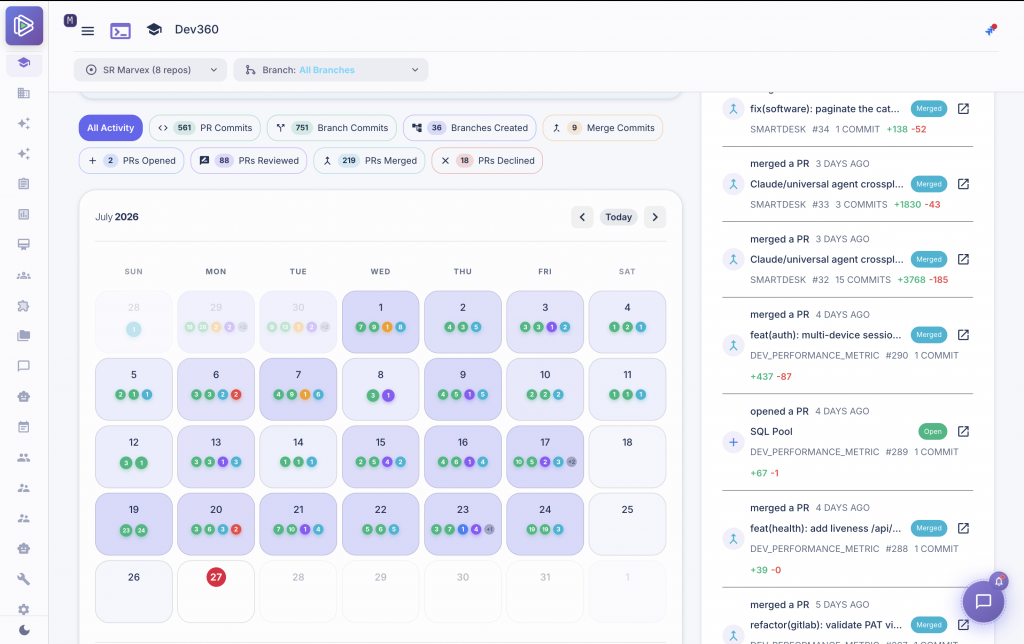
The core loop of Marvex is: observe developer activity → normalize it → attribute it correctly → aggregate it into metrics. Here’s how a code change becomes a number on a dashboard.
1. Ingestion — real-time and scheduled
Data lands two ways. Webhooks give us near-real-time updates on pushes, pull requests and CI runs. A scheduled sync backfills anything the webhooks missed and reconciles state. Both paths funnel through the same orchestration code, so there’s a single source of truth for how a repository gets synced.
Because sync jobs run under parallel workers, we use distributed locks to guarantee that two workers never sync the same repository at the same time. Idempotency and safe coordination are treated as non-negotiable parts of every sync flow — a duplicated or half-finished sync is worse than a slightly delayed one.
2. Attribution — who actually wrote the code
One of the subtler problems in engineering analytics is line-level attribution. A naive system credits every commit in a pull request to whoever opened the PR. That’s wrong — and it quietly distorts every “lines changed” and “contribution” number downstream.
Marvex attributes lines to the engineer who actually authored each commit, reading per-commit authorship and change counts directly. A few details matter:
- Author identities are normalized so the same person isn’t split into two by inconsistent casing or formatting.
- We distinguish “not yet computed” from a genuine zero, so empty commits and un-backfilled data don’t look the same.
- Attribution is precise where a provider exposes per-commit statistics, and falls back gracefully to PR-level attribution where it doesn’t — rather than guessing.
This single correction feeds many surfaces — team metrics, engineer drilldowns, PR-size views, per-developer sprint stats, org-level rollups and exported reports — so getting it right once fixes them all.
3. Aggregation — DORA and beyond
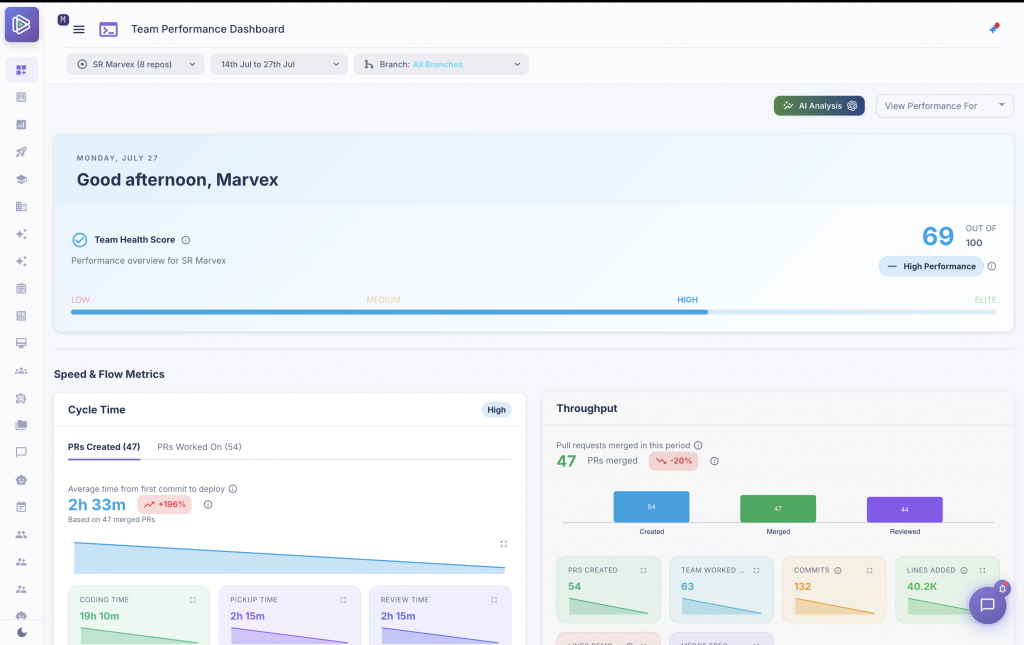
With clean, attributed data, Marvex computes the metrics engineering leaders care about.
The four DORA metrics:
- Deployment frequency — how often we ship to production.
- Lead time for changes — from first commit to deploy, as a weighted average across repositories.
- Mean time to recovery (MTTR) — how quickly we recover from incidents.
- Change failure rate (CFR) — the share of deployments that cause an incident.
Deployments are detected from multiple sources — CI/CD workflow runs, release tags, and merges into production branches — with per-repository configuration for what “production” means. Incidents come from CI signals, PR-based detection, or external tools, and are mapped back to the deployments that caused them to produce CFR and MTTR.
Team and org dashboards roll these up across categories like speed, throughput, review quality, PR size, stability, activity and risk. Hot paths are cached so that a dashboard for a team with hundreds of open PRs still loads quickly, and caches are invalidated as new activity arrives.
SALT — a lightweight agile tracker
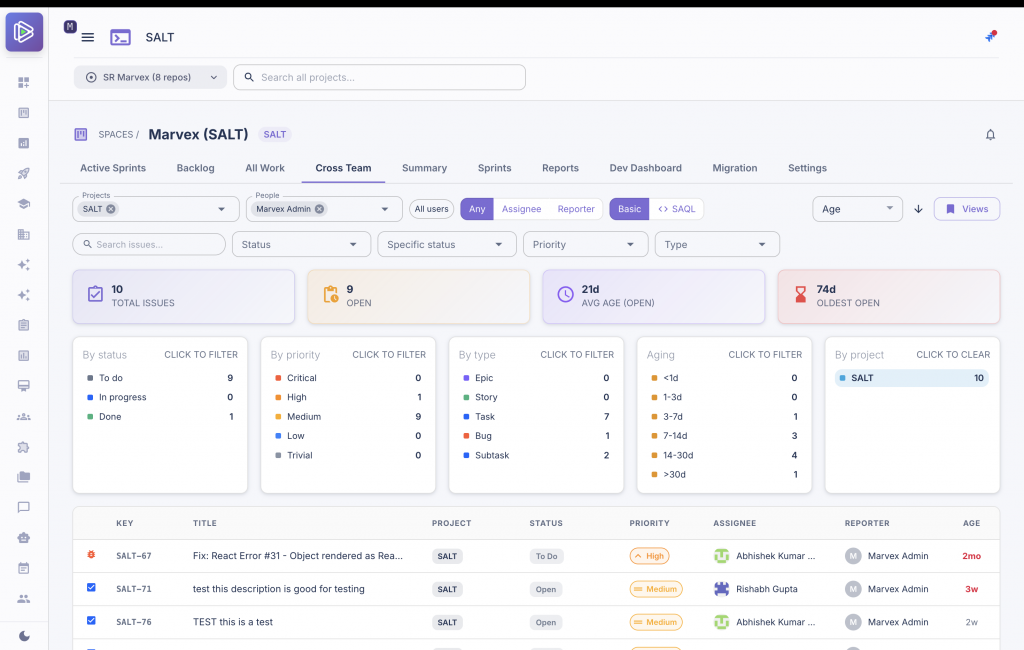
Not every team wants to live in a heavyweight issue tracker. SALT (Smart Agile Lifecycle Tracker) is Marvex’s built-in alternative: a full issue, sprint and board system with a configurable workflow engine, comments, attachments, components and an audit trail — plus AI assistance and outbound webhooks.
Its capabilities break down into a few focused areas:
- Issue management — issue CRUD and state transitions through configurable workflows.
- AI assistance — drafting issue descriptions, auto-classifying issues, detecting likely duplicates, and linting acceptance criteria for quality.
- Webhooks — reliable delivery of issue and sprint events to external subscribers, with retries and an audit trail.
- Query interface — a lightweight query language so teams can search issues programmatically.
- Migration — a one-time backfill that imports an org’s existing history from other trackers.
Two engineering details are worth highlighting.
Outbound webhooks are protected against SSRF. SALT lets an org register external URLs to receive events. That’s a well-known class of security risk, so the webhook layer validates destinations and refuses to deliver to internal, non-public addresses. This protection is a first-class requirement of the feature, not an afterthought.
Search is bounded by design. An unbounded search across many projects is an easy way to overload a system. When a query is broad, SALT caps the work rather than letting a single request degrade the experience for everyone.
SALT is also exposed to AI tooling through a standard tool interface, letting AI assistants query and manipulate issues in a well-defined, permissioned way.
Velo — the multi-channel AI assistant
If Marvex answers “what are our metrics?”, Velo answers “just tell me what I need to know” — in plain English, wherever the user already is.
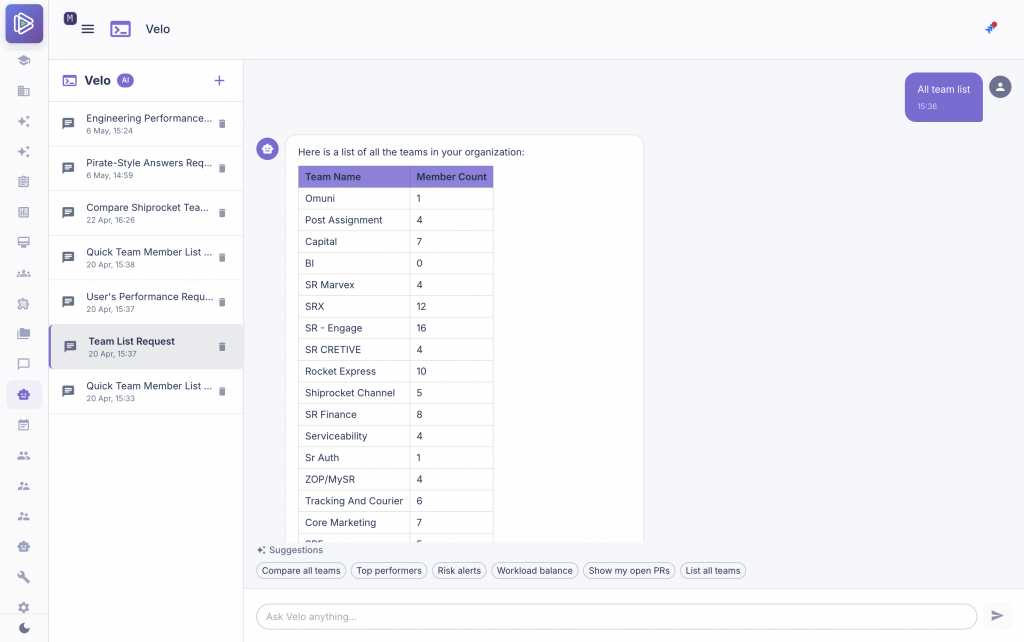
Velo is a conversational assistant available on Web, Slack and WhatsApp. Ask it “How did the payments team do last sprint?” or “Show me risky PRs older than a week,” and it routes your natural-language question to the right data and answers in the format that fits the channel.
Under the hood, Velo is a small pipeline of specialized steps:
- Intent classification maps free text to one of dozens of intents across capability areas — PR analytics, DORA health, sprint velocity, risk alerts, team comparison, workload and more.
- Identity resolution figures out who is asking. People sometimes have more than one work identity across systems, so Velo links a Slack or WhatsApp identity back to the right Marvex user with sensible fallbacks.
- Data aggregation does the heavy lifting — pulling PR, team, DORA, Jira and incident data to satisfy the request. Crucially, this is role-scoped: Velo only returns data the asking user is authorized to see. Two people asking the same question get answers bounded by their own access.
- Response generation formats the result for the channel — a rich card on the web, a message on Slack, a concise reply on WhatsApp.
Conversation history is stored per organization and per user, and Velo normalizes fuzzy date ranges (“last week,” “this quarter”) into the standard time windows the metrics engine understands.
Because Velo can reach across many data sources in a single answer, role-scoped access is the central safety property of the whole feature — and it’s treated and reviewed as such.
The other pieces that make it work
Marvex is more than DORA, SALT and Velo. A few subsystems quietly do a lot of work:
- AI-adoption tracking. As engineering teams adopt AI coding tools, Marvex rolls up usage by team, person and project — including cost — so leaders can see, at a glance, whether the investment is paying off. Access to cost data is restricted to the same organization, and raw data is retained only for a bounded window.
- Planning Poker with tracker sync. Distributed estimation sessions write story points back to the team’s issue tracker, handling the fact that different teams configure their fields differently.
- Sprint forecasting and velocity trends. Marvex computes points completed, throughput and multi-sprint velocity trends, and flags burndown deviations and mid-sprint scope creep — the unplanned work that silently sinks commitments.
- Privacy-conscious chat. A secure messaging experience for teams, with content encrypted at rest.
Security and multi-tenancy, by design
Because Marvex holds sensitive engineering data for many organizations at once, a few principles are baked into the architecture rather than bolted on:
- Tenant isolation is an invariant. Every query is scoped to a single organization. A query that isn’t is treated as a potential data-leak bug — full stop.
- Sensitive data is encrypted at rest. Integration credentials and chat content are stored using strong, authenticated encryption.
- Authorization gates every endpoint. Token-based authentication plus role checks sit in front of the API, and data access for features like Velo is role-scoped so that access control follows the data, not just the route.
- Outbound requests are guarded. Anywhere the platform contacts a user-supplied URL, internal network destinations are blocked to prevent server-side request forgery.
We keep the specifics of these controls internal by design — but the principles above are the ones we hold ourselves to.
Why we built it this way
A few choices define Marvex more than any single feature:
- Separate the slow work. Sync belongs in a background worker, not the request path. This one decision keeps dashboards fast no matter how large a backfill runs behind them.
- Centralize data access. A single data layer means database concerns — tenant scoping, locking, transactions — live in one place we can reason about and secure, instead of being scattered through business logic.
- Correctness before cleverness. Line-level attribution is the clearest example: the “obvious” approach is subtly wrong, and fixing it once repaired every view that depends on it.
- Meet users where they are. Velo on Slack and WhatsApp exists because the best analytics platform is the one people actually ask questions of — and most people don’t want to open a dashboard to find out how last sprint went.
What’s next
Marvex is evolving from a system that measures engineering into one that assists it. SALT’s AI features and Velo’s conversational interface are the leading edge of that shift — moving from “here are your metrics” toward “here’s what to do about them.” Exposing our engineering data through standard AI tool interfaces points the same direction: making it a first-class, queryable surface for the next generation of AI tooling.
If you’re building something similar, our biggest takeaway is unglamorous but real: get your data model and your attribution right first. Beautiful dashboards and clever AI are only as good as the numbers underneath them.
Built by the Marvex Platform team. Questions or feedback? We’d love to hear how you measure engineering productivity.