- Database optimisation : The Game Changer for Shiprocket
- Foreign key constraints: Friend or Foe?
- Deferred Joins: A Better Approach to Data Retrieval
- Force Index: Helping MySQL Choose the Right Path
- Key-based pagination instead of offset-based: A Faster Alternative
- Conclusion: Scaling Your System with Optimised Queries
In the fast-paced world of eCommerce and logistics, millisecond defines the difference between successful shipping and missed opportunities. For Shiprocket, where speed and efficiency are paramount, we believe that even the slightest delays can ripple into significant customer dissatisfaction, operational slowdowns, and lost revenue. With our business scaling up and an increased demand for our services, we continuously strive to keep up with the complexity of managing and optimizing application performance.
Database performance can be a game-changer in the data-driven world of modern applications. A slow database can bottleneck your system, turning smooth operations into frustrating delays. For a platform like Shiprocket, which powers logistics for thousands of MSMEs, it is crucial to maintain peak application performance at all times.
In the past years, Shiprocket has faced several performance bottlenecks due to unexpected spikes in traffic, a heavy influx of data, and evolving customer demands. These were potentially slowing down our processes and affecting user satisfaction.
To ensure that our platform functions with the same efficiency and remains fast, reliable, and scalable, we had to optimise our app performance. This is where MySQL came to our rescue. Whether it’s handling large volumes of shipments, processing complex queries, or managing millions of transactions, MySQL performance plays a critical role in keeping our operations smooth.

Database optimisation : The Game Changer for Shiprocket
At Shiprocket, we prioritise a seamless user experience, especially when handling high volumes of order processing and shipping data. One of the key tools we use to manage this data is MySQL, a widely-used database management system.
Think of MySQL as the backbone of our application. It stores all the vital information needed to ensure your shipments are processed quickly and accurately. Whether it’s customer details, order information, or inventory data, MySQL helps us keep everything organized so we can retrieve the data efficiently when needed.
As Shiprocket continues to scale, we’ve focused on optimizing our app’s performance. This means making sure that accessing and managing data in MySQL happens as fast as possible. Over time, as more users and data come in, it’s important to ensure that our database doesn’t slow down. By fine-tuning how we use MySQL, we can keep our app running smoothly, even with the growing demands.
Now let’s dive into some of the key strategies that we implemented to optimise queries and improve overall system performance.
Foreign key constraints: Friend or Foe?
Foreign keys often lead to performance bottlenecks, especially during high-write operations. When foreign keys are imposed every UPDATE, INSERT, or DELETE command checks the related table integrity which in turn results in locking of tables, and increases the likelihood of Deadlock. A common cause of Lock wait timeout error. Even though there is row based locking in MySQL it happens. To do a PoC visit the Reference link below.
To resolve this and manage relationships at the application level, we worked thoroughly. The solution was to drop FOREIGN KEY constraints in our production database schema definition, ensuring we didn’t drop the index. This technique is crucial for optimizing large-scale systems. By managing relationships at the application level through Hibernate in our case, we maintained data integrity while eliminating the potential drawbacks of DB-level foreign key constraints.
A hidden advantage of this strategy was that it opened up the option for partitioning tables. Foreign key constraints impose significant limitations on table partitioning in MySQL. One of the key restrictions is that both the parent and child tables must be partitioned on the same columns and use the same partitioning strategy. This limits flexibility in how data is distributed, as every related table must follow the same partitioning scheme, which might not be ideal for all data sets.
Even when we were on a schema-based multi-tenancy, dropping constraints seemed like a daunting task, we went ahead with it. In our case, when we needed to drop foreign key constraints, we were faced with managing over 100 schemas, each containing around 50 tables. To efficiently tackle this challenge, we developed a Python script that accepted a CSV record as input, detailing the schema names. This script automated the entire process by retrieving the relevant table names and their respective foreign keys, allowing us to seamlessly drop the foreign key constraints across multiple schemas. This solution not only saved significant time and effort but also minimized the risk of human error during what would have been a complex and time-consuming manual operation.
Reference : https://stackoverflow.com/questions/54672633/do-mysql-transactions-for-insert-lock-foreign-key-referenced-tables
Deferred Joins: A Better Approach to Data Retrieval
Deferred joins can help avoid several problems encountered in complex database systems. Key problems included multiple joins on large tables, which resulted in slow queries.
Fetching all related data in one go can lead to over-fetching, where more data than necessary is retrieved.
In our case, we had multiple joins, and all the data was getting fetched from tables. After that, we applied where conditions due to which the query became too slow.
By using deferred joins, the database workload was minimized. In systems where relationships are managed at the application level, such as with Hibernate, deferred joins offer more control over when and how related data is retrieved. This approach prevented the performance issues associated with eager loading and ensured that queries remained lightweight and efficient. Initially, only the necessary data was fetched with appropriate filters, and then the join was performed, reducing data processing and enhancing query performance.


Reference : https://aaronfrancis.com/2022/efficient-mysql-pagination-using-deferred-joins-15d0de14
Force Index: Helping MySQL Choose the Right Path
MySQL often struggles to determine the optimal index to use when fetching data, especially in complex queries with multiple WHERE conditions. While MySQL’s optimiser usually handles index selection well, in certain cases—such as when multiple columns are involved in the WHERE clause—it can make suboptimal choices. This led to increased query cost, slower execution times, and inefficient use of resources. But the INDEX is there to leverage the faster response out of it.
To assess query cost and identify whether the expected INDEX is currently being used or not, we typically rely on the `EXPLAIN` statement. MySQL Workbench offers a visual representation of the query execution plan, displaying all tables involved along with their respective query costs. It provides valuable insights into how data is being retrieved, such as whether an index is being used, unique columns are being leveraged, or if a full table scan is taking place. This analysis helped us fine-tune queries for optimal performance by understanding the database’s execution strategy.
Steps to generate a visual representation of an `EXPLAIN` statement for a query –
- Firstly, Run the desired query on your MYSQLWOrkbench
- Click on Query -> “Explain current Statement” in the top menu bar.
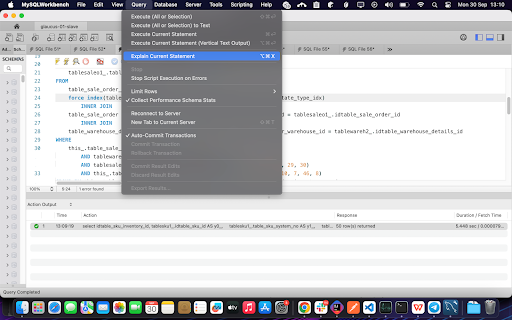
- You can see the Tabular representation of the Explain output
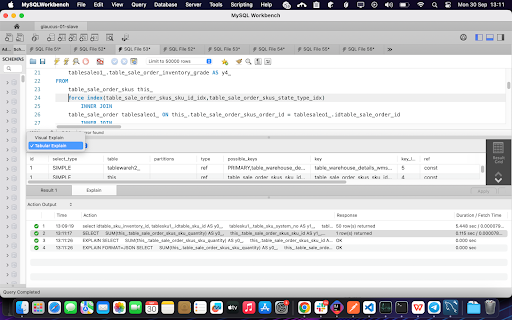
- You can also see the Visual Representation of EXPLAIN Statement of your query
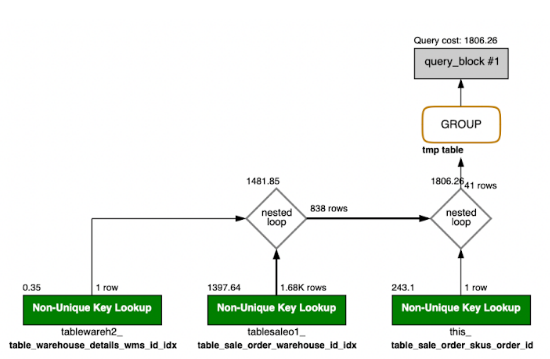
In many cases, queries slow down due to the absence of an index on the queried column. Even when indexes are present, it’s crucial to ensure the correct one is used. To optimise performance, we applied `FORCE INDEX` on the column within the `WHERE` clause, ensuring the query optimiser selects the index as per the criteria given and not some random index. This is particularly useful in complex queries involving multiple tables, where composite indexes—covering multiple columns—can be utilised to handle several conditions with a single index, reducing query time and resource consumption.
At the application level, where frameworks auto-generate queries, we leveraged Hibernate’s `MySQLDialect` along with the `queryHint` method to enforce specific indexing strategies, including composite indexes. This ensured that the most efficient index was applied based on the query structure. This approach helped us optimize complex queries and improve performance across large datasets.
Below, you can see the implementation of “use index” with custom MySQLDialect – https://stackoverflow.com/questions/46074676/mysql-index-hints-in-hibernate-query/78344835#78344835
Reference : https://support.servicenow.com/kb?id=kb_article_view&sysparm_article=KB0760378
Identifying slow queries: Monitoring Tools
“Identifying slow queries is crucial for optimising database performance and improving overall system efficiency. Fortunately, various tools and techniques are available to help monitor and diagnose slow-running queries in real-time without any additional overhead on the application.”
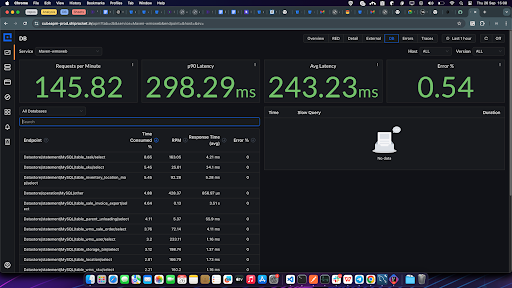
Application Performance Monitoring (APM) Tools :
- CubeAPM, NewRelic, Pinpoint (Java): These APM tools provide detailed insights into application performance by tracking database queries, their execution times, and overall system impact. They allow you to trace specific queries within the context of a transaction and pinpoint which queries are causing slowdowns.
Cloud Tools :
- AWS Performance Insights: A cloud-native tool that helps you monitor and tune your databases on AWS. It provides real-time query performance metrics, including execution time, wait events, and resource utilization, helping you identify problematic queries.
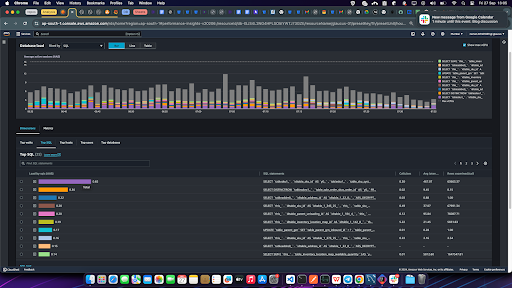
- Google Cloud Query Insights: Similar to AWS Performance Insights, this tool offers a visual breakdown of query performance for databases running on GCP, helping diagnose slow queries.
Percona Monitoring and Management (PMM)
Percona Monitoring and Management (PMM) offers a comprehensive suite for monitoring and analyzing query performance. It provides real-time metrics and query analytics, displaying execution times, frequency, and resource usage for queries. It helps identify long-running queries and database bottlenecks.
Now, let us list a few commonly quoted best practices so that this blog can act as a comprehensive playbook or code review checklist.
Strictly avoid SELECT queries in loops :
Frameworks may lure new developers into using a dao method in a loop without warning about the unforeseen performance death. The use of SELECT queries inside loops can significantly degrade performance, especially in large datasets. Each iteration results in a separate query execution, causing an unnecessary overhead on the database and slow response time.
Instead, retrieving the required data in a single query outside the loop is more efficient, reducing the number of database calls and improving overall system performance. By fetching all the necessary data at once and storing it in a `HashMap` or similar data structure, you can easily access the data within the loop. This approach not only minimises database interactions but also allows faster lookups from memory, ensuring that repeated queries are avoided and the system runs more efficiently.
Use caching for less volatile data
Utilising caching for less volatile data can significantly enhance application performance and reduce database load. By storing frequently accessed data in memory (redis), applications can quickly retrieve this information without repeated queries to the database. This is particularly beneficial for data that doesn’t change often, such as configuration settings or reference data, as it minimises the need for database round trips.
Implementing caching strategies, such as using in-memory data stores like Redis or Memcached, ensures that the application runs more efficiently while maintaining data consistency.
Lazy Loading (Applicable to JPA or similar frameworks)
Using eager loading means that all the tables joined or mapped at the application level are fully fetched whenever the parent table is queried. While this can be convenient, it often leads to increased query execution time and unnecessary memory consumption. By retrieving large datasets upfront, eager loading can strain system resources and slow down performance, especially when only a subset of the data is needed.
Instead, employing lazy loading or deferred loading strategies allows for more efficient data retrieval by fetching only the necessary information on demand. Lazy loading defers the loading of related entities until they are explicitly accessed, which significantly reduces initial query time and memory consumption, as only essential data is loaded into memory.
Reference – https://www.baeldung.com/hibernate-lazy-eager-loading
Key-based pagination instead of offset-based: A Faster Alternative
Key-based pagination is a more efficient way of navigating through large datasets than traditional offset-based pagination. In offset-based pagination, queries retrieve records by skipping a specified number of entries, which can lead to performance issues as the dataset grows larger. Each time a user requests a different page, the database must scan through the skipped rows, resulting in increased query execution time and resource consumption.
In contrast, key-based pagination uses a unique identifier, such as a primary key, to mark the starting point for fetching the next set of records. This method allows the database to access the required records directly without scanning through all previous entries, significantly improving performance, especially in large datasets. Key-based pagination is more efficient because it avoids the overhead associated with calculating offsets, making it ideal for applications that require rapid and responsive data retrieval. Additionally, it provides a smoother user experience, as users can quickly navigate through large lists without noticeable delays.
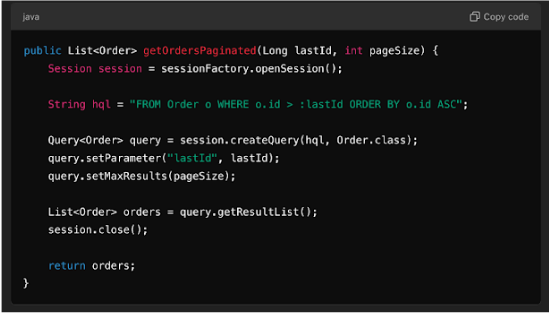
All these strategies contribute significantly to scaling the system and addressing issues related to high CPU usage. By optimizing data retrieval through methods like lazy loading, deferred loading, and key-based pagination, we reduce the computational overhead on the database and minimize resource consumption. These optimisations not only improve response times but also allow the system to handle larger volumes of data more efficiently. As a result, the overall load on the CPU is alleviated, leading to enhanced performance and the ability to support more concurrent users without degradation in speed or efficiency. Implementing these strategies fosters a more robust architecture, ensuring that the system remains responsive and capable of scaling to meet increasing demands.
Conclusion: Scaling Your System with Optimised Queries
By adopting these strategies, we significantly reduced CPU load and improved the scalability of our system. Optimising data retrieval through techniques like deferred joins, lazy loading, and key-based pagination helped us alleviate the burden on the CPU and the database, ensuring that your application remains responsive and efficient under growing demands.
Investing in query optimisation not only enhanced performance but also future-proofed our application as user numbers and data volumes continue to rise.
With these optimisations in place, you can rest easy knowing that your MySQL-powered application is ready to handle whatever load comes its way.
